Variable Injection Rates? Why? for weight based CT scans
The rates in the table are the injection rates of intravenous contrast agent. The units are in milli-litres per second.
Fixed injection rates for enhanced CT scans are common in most published protocols. They usually use rates of 2 to 5 mls per second, injected intravenously with a mechanical power injector. When a fixed dose is used (eg, 100ml in all patients) it is appropriate to use a fixed injection rate. But when the dose varies according to body weight, it is appropriate for the injection rate to also vary. In the discussion below, reasons are given for not using fixed rates, followed by reasons why these particular varying rates were chosen.
Tello et al recently demonstrated1,2 that the time to peak liver enhancement is correlated with the elapsed time from the END of the contrast injection. That is, if the injection ends earlier, the peak liver enhancement occurs earlier, and if the injection ends later, the peak liver enhancement will occur later. If a fixed injection rate were used with variable dose volumes, the elapsed time to the end of injection would vary considerably, and therefore the timing of peak liver enhancement would wary considerably too, which is not desirable. For example, the table below shows the injection time required if a fixed injection rate of 2.6ml per second were used.
| Weight group | 31-37kg | 38-47kg | 48-63kg | 64-77kg | 78-97kg | 98-117kg | 118+kg |
| Dose volume | 60ml | 70ml | 80ml | 100ml | 120ml | 140ml | 160ml |
| Injection Rate | 2.6ml/s | 2.6ml/s | 2.6ml/s | 2.6ml/s | 2.6ml/s | 2.6ml/s | 2.6ml/s |
Time needed to inject the Dose |
23.1 secs | 26.9 secs | 30.8 secs | 38.5 secs | 46.2 secs | 53.8 secs | 61.5 secs |
As you can see in the last row, the injection times would vary from 23
seconds to 61 seconds, | |||||||
Another problem in the table above, using an example fixed injection rate of 2.6ml/sec, is that the larger dose volumes would require 54 - 61 seconds to inject the contrast. It neglects to consider that contrast also needs at least an additional 20 seconds to circulate in the chest (right heart > lungs > left heart > aorta) before even reaching the abdomen... requiring an even longer scan delay before starting to scan.
On the other hand, if variable injection rates were chosen, to achieve a constant injection Time of, for example, 37 seconds, then the injection rates would have to vary considerably, as shown in the table below.
| Weight group | 31-37kg | 38-47kg | 48-63kg | 64-77kg | 78-97kg | 98-117kg | 118+kg | To achieve constant injection Times, for example 37 seconds, the injection rates would have to vary from 1.6ml/sec up to 4.3ml/sec. |
| Dose volume | 60ml | 70ml | 80ml | 100ml | 120ml | 140ml | 160ml | |
| Injection Rate | 1.6ml/s | 1.9ml/s | 2.2ml/s | 2.7ml/s | 3.2ml/s | 3.8ml/s | 4.3ml/s | |
Time needed to inject the Dose |
37 secs | 37 secs | 37 secs | 37 secs | 37 secs | 37 secs | 37 secs |
Back in 1996, when these weight based protocols were being first developed, we didn't know what Tello published in 1997 about peak hepatic enhancement correlating with the end-Time of contrast injection. But we did know that the level of peak liver enhancement also correlated with rate of injection3. Higher injection rates are generally believed to lead to higher peak levels of enhancement than lower injection rates. Therefore, the method of using varying injection rates between weight groups, was a novel proposal that caused some worries. ( Luckily, the worry was unfounded. The results of liver enhancement were quite uniform across all groups. The heavier patients with faster injection rates did not have higher liver enhancement than the lighter patients. )
A compromise approach was chosen: to use variable injection rates, but to compress their range of variability. The method used to do this, was achieved by basing the Rate on the approximate average Body Surface Area of patients in each weight group.
| Weight group | 31-37kg | 38-47kg | 48-63kg | 64-77kg | 78-97kg | 98-117kg | 118+kg | These are the injection Rates that are actually used in the protocols. |
| Dose volume | 60ml | 70ml | 80ml | 100ml | 120ml | 140ml | 160ml | |
| Injection Rate | 2.0ml/s | 2.2ml/s | 2.4ml/s | 2.6ml/s | 2.8ml/s | 3.1ml/s | 3.3ml/s | |
Time needed to |
30.0 secs | 31.8 secs | 33.3 secs | 38.5 secs | 42.9 secs | 45.2 secs | 48.5 secs |
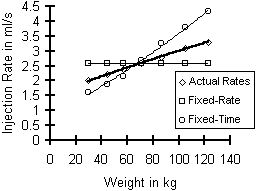
This graph shows a comparison of the 3 types of Rates, described above. The actual rates are shown by the thicker line. The Fixed-Rate line uses 2.6ml/second. The Fixed-Time line used rates that would achieve an injection time of 37 seconds. As this graph shows, the Actual Rates were a half-way compromise between two different concepts.


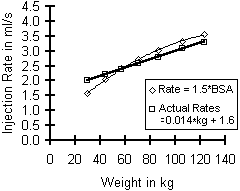
The Actual Rates used in the protocols, were approximately based on the formula Rate=1.5 x BSA, where BSA is the estimated mean Body Surface Area of the patients in each weight category. This was an attempt to base the Actual Rates on something physiological. But, as this graph shows, the Actual Rates do not match perfectly with the formula. They actually match the linear formula: Rate = 0.014 * kg + 1.6.
Using BSA in medical formulas is sometimes useful, because it scales fairly linearly in the pediatric population and small adults, and it gradually plateaus in the heavier adult patients. It provides a smooth transition from pediatrics to adults. Oncologists commonly prescribe per-BSA doses of chemotherapy, and although pediatricians often use per-Kilogram doses, they sometimes use per-BSA doses when it is important for safety and consistency to use the same dose formula in both adults and children. Both groups of doctors would consider it dangerous to use a fixed dose for all patients. The same argument can be made for injection rates. It would certainly be dangerous to inject contrast at adult rates into pediatric patients, and the same logic could apply to small adults versus large adults.
References:
- Tello R, Seltzer SE, Polger M, Spaulding S, Savci G, A contrast agent delivery nomogram for hepatic spiral CT. J Comput Assist Tomogr 21:236-45, 1997.
- Tello R, Seltzer S, Effects of Injection Rates of Contrast Material on Arterial Phase Hepatic CT. Am J Roentgenol, 173:237-8, 1999.
- Kim T, Murakami T, Takahaski S et al, Pancreatic CT Imaging: Effects of different injection rates and doses of contrast material. Radiology 212:219-225, 1999.
back to CT scan weight based protocols
End of page Navigation links: Halls.md home or Back to top
Copyright © 1999 - present. Steven B. Halls, MD . 1-780-608-9141 . [email protected]